![]()
![]()
|
|
|
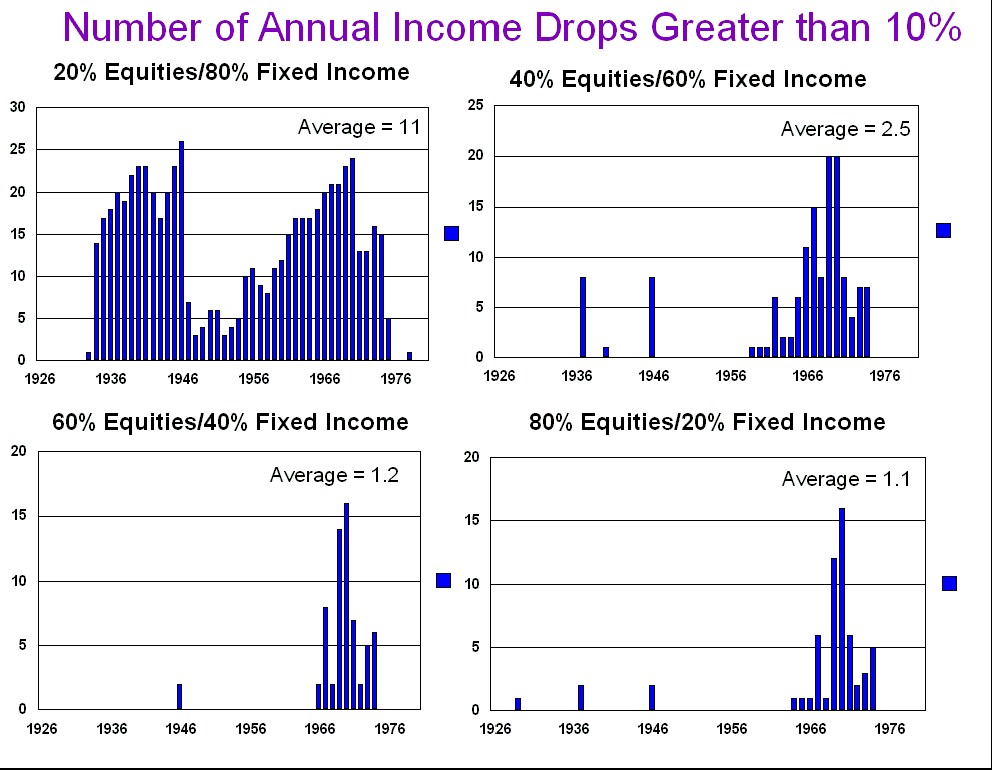
This graph shows the number of years (for each of the 54 different 30 year retirement scenarios) that you would have encountered an income drop of greater than 10% of your target income. The starting conditions were a fixed annuity of $22,000/year, an inflation adjusted income goal of $44,000/year, and a starting portfolio value of $716,700 (which is 22,000 x 9.85 + 22,000/.044). The withdrawal methodology was described in the Combining It All section.
|