![]()
|
|
|
|
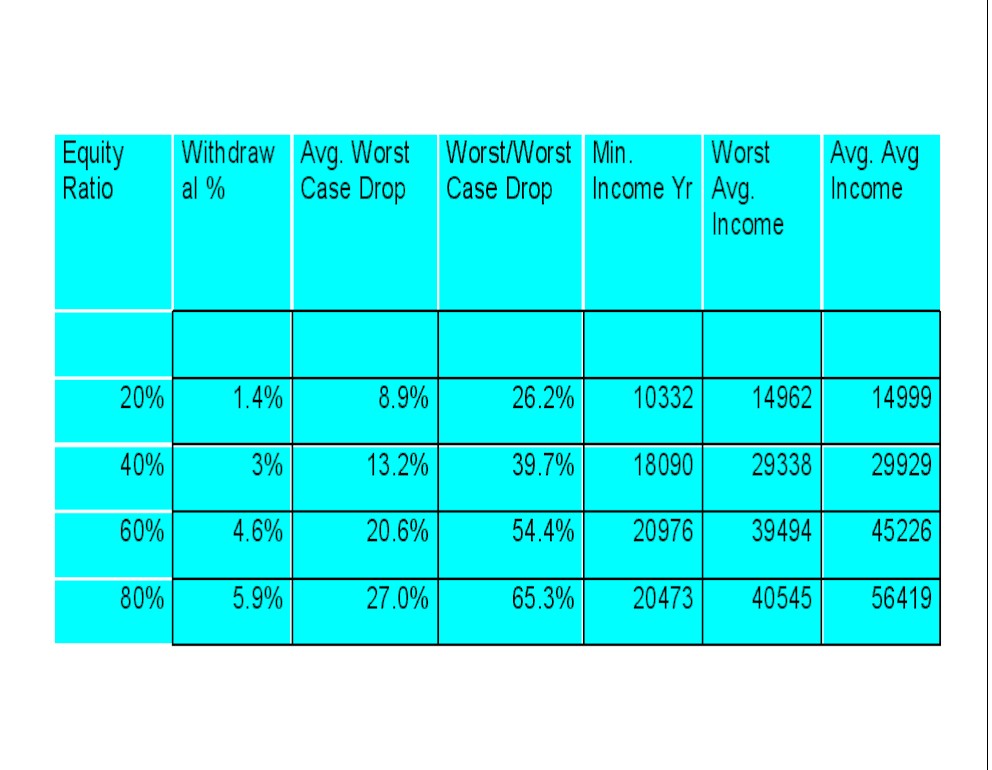
This chapter is intended to analyze the case of withdrawals from a portfolio with the goal of having the portfolio support inflation-indexed withdrawals forever (for the Market Risk scenario). This was my choice of analytical context for the case of a person retiring in their early 50's who must face the reality of a 45 year (or even longer) remaining lifetime (as if this is something to complain about). I was initially uncomfortable with the results of this analysis. But I recently (re) discovered analysis from another well-respected source that supports this analysis. It is the Retirement Calculator From Hell on the previously referenced Efficient Frontier by William Bernstein (VERY highly recommended if you are willing to put forth a bit of mental energy). So I'm now more comfortable with this data. My first inclination was to simply extend the analysis to cover more years. But the goal was to simulate 'forever', so I decided to do this using the same 30 year scenarios as before with these additional restrictions/changes from the Market Risk chapter. 1) After 30 years the (inflation adjusted) ending portfolio value must be the same as (or larger than) the initial portfolio value. 2) The limiting withdrawal percentage is constant rather than allowing it to rise in the later years. In other words in all cases you were at least as well off at the end of 30 years as you were at the beginning. What we are looking at here is the statistics of 54 different 30-year retirement scenarios (with the additional constraint of requiring an ending portfolio be the same (after inflation) as the initial portfolio). The data presented is: 1) The limiting withdrawal percentage that guaranteed #1 above (no worse off after 30 years than when you started). Remember that the withdrawals drop when your portfolio drops. 2) The 'average worst case drop' encountered across all of the 54 different 30 year retirement simulations for each different equity ratio. You take the worst case single year income drop in each 30 year retirement scenario and then average those values. 3) The 'worst, worst case drop' encountered in each of 54 different 30 year retirement scenarios. This is the largest single year income drop that occurred in the entire simulation for the given asset allocation. 4) The absolute minimum (inflation adjusted) single year income that you would have encountered for that asset allocation. Note that this can be calculated directly from #3 above. 5) The worst average income across all the 54 different 30-year retirement scenarios. 6) The average of all the average incomes across the 54 different 30-year retirement scenarios. The results are shown below - they are
not what I expected at the higher equity ratios. First to be sure that the data is understood take the 40% equity ratio row. 3% withdrawals/year guaranteed that at the end of 30 years you always had your initial (inflation adjusted) portfolio value available. I simulated the same 54 different 30 year retirement scenarios and I took the worst case income drop in each of these 54 different scenarios and averaged those values (result was 13.2%). The worst single year income drop seen across all those 54 scenarios was 39.7% and the minimum (inflation adjusted) income across all 54 scenarios was $18,090. The lowest average income across each of the 54 different scenarios was $29,338. The last column is simply the average of all the average incomes ($29,929 in this case). The results for the 20 and 40% equity ratios were not surprising. But I did not expect the infinitely sustainable withdrawal rates to be higher than the 4.4% that I started with (and most certainly NOT 5.9%!). Note that 4.4% originally came from the Trinity/Jarrett withdrawal methodology (strictly inflation adjusted withdrawals and a non-zero ending value being acceptable), but I was not prepared for 5.9%. In the case of Market Risk (4.4% scaled withdrawals) and 80% equity ratios, the 'Avg. Worst Case Drop' was 18% rather than 27% so this too is not a free lunch. Note also that in the worst retirement scenarios, you did not achieve a higher average income by upping your equity ratio and your withdrawal target. But I still find the concept of 5.9% withdrawals ... well ... not recommended for people looking at 40+ year retirement possibilities. I'm publishing this but would be interested in comments from readers by email or in conversation #382 in 'Investing During Retirement' at MorningStar.com.
ADDITIONAL DISCUSSION I have done some further analysis of this approach. I started from the perspective of 'withdrawing forever' which sounds like a move to a more conservative withdrawal strategy. I had assumed that 'conservative withdrawal strategy' and 'reduced initial withdrawal' are synonymous, but this is not necessarily the case. A better way to look at this is to consider this from the perspective of the following goals. 1) Maximize total withdrawals 2) Minimize volatility (or at least to minimize the 'less income than planned' side of the equation - few would believe that sudden, unexpected increases in income are a bad thing assuming no other negative consequences) 3) Minimize your risk of 'going broke' You have to trade off these three conflicting goals and this chapter is ultimately about maximizing #1 and #3 and letting #2 (volatility) fall where it may. So if that is your goal some quick simulations that I did last night reveal that withdrawing a constant percentage of your portfolio (in the 4-5% range) is more effective in maximizing your total withdrawals while maintaining your portfolio value over the long run than is raising your withdrawal percentage target but limiting your withdrawals in years that your portfolio is doing well. In retrospect this should have been obvious. When I get a chance I'll be re-working this chapter and complete the analysis in referenced in the previous paragraph. |