![]()
![]()
|
|
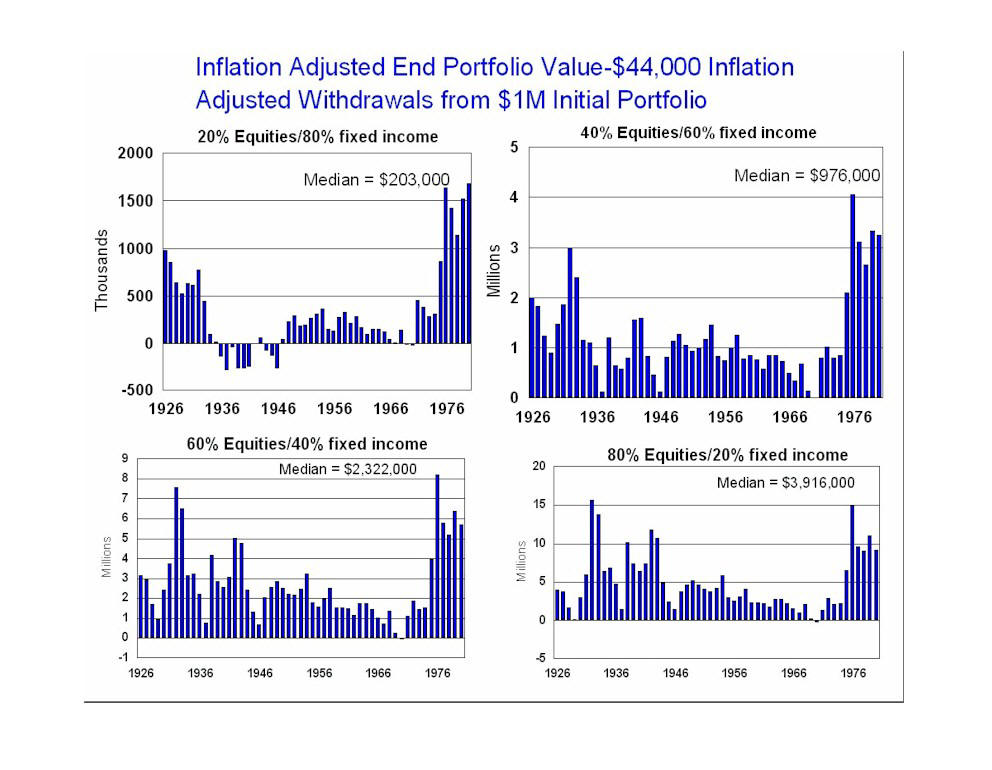
The following graphs show the inflation adjusted end portfolio values (after 30 years) for the market conditions described in the Ibbotson data and the asset allocations and withdrawal methodology described in Methodology. Note that ending negative values have no real meaning beyond "the portfolio failed before 30 years". In the Jarrett/Trinity studies these four graphs would have simply been four "pass/fail" points in their data. In this case all the asset allocations except for 40/60 would have been 'fail'.
|