![]()
![]()
|
|
|
|
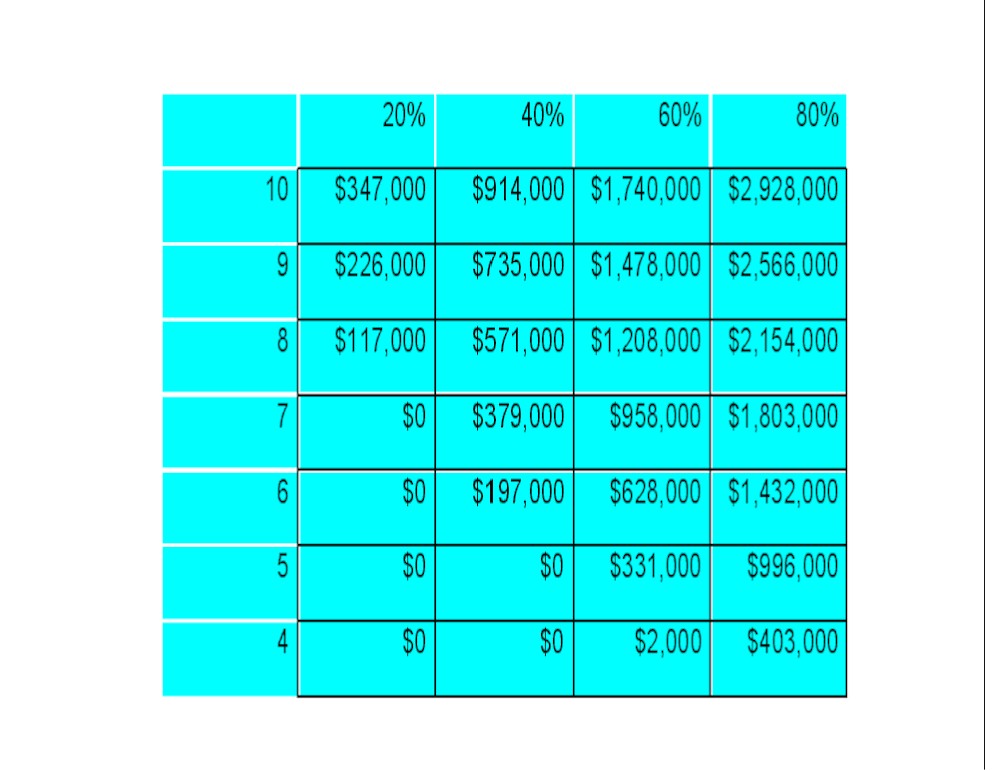
The following table shows the median (inflation adjusted) final value of the portfolios providing inflation protection over a 30 year period to a fixed annuity of $44,000/year. Failing portfolios were all treated as having a final value of exactly zero. 54 different 30 year retirement scenarios were simulated (initial retirement year varied from 1926 to 1979). The rows vary the initial portfolio amount between 4x and 10x the annual annuity amount. The columns vary the equity ratio (percentage of the portfolio that is allocated to Small Cap and Large Cap stocks) from 20% to 80%. The details of the simulation are stated in Methodology and Fixed Annuity chapters. Note that the beginning portfolio values are different depending on the annuity factor (between 4 and 10) chosen in the left side column.
The table below shows the same data but with the median final (inflation indexed) portfolio value being expressed as a percentage of the initial value.
|